


RELIABLE SUBMETERING
In situations where buildings are operated, it is often important to accurately and regularly allocate energy costs. Our Energy Management System EnergyGrip makes efficient submetering for organizations simple. Aurum is one of the few providers that can measure independently through our Nextalink: the solution seamlessly integrates with existing infrastructure (we connect the meters; gas, electricity, heat, water, and/or solar panels of apartments). The Nextalink provides a reliable and independent way to measure and communicate data. We strive to guarantee 100% of the daily measurements by offering multiple communication channels, ensuring that data is always reliably and timely transmitted. These accurate and up-to-date data give building managers more control over the infrastructure and processes and open the possibility of offering new services.
Optimal Configuration
EnergyGrip ensures that organizations can optimally balance supply and demand in the building. The entire chain is supported: from water to heat. This leads to more efficient energy use and cost savings.
Features
With EnergyGrip, you gain insight into all your energy data and maintain an overview.
- Access to energy data from all your locations.
- Analysis of consumption (invoice data and measurement data of gas, electricity, and heat).
- Invoice processing and control; we handle communication with the supplier and network operator based on customer authorization.
- One central location for all your energy-related documents, including documentation for your energy registration and monitoring system (EBS). Other documents, such as CO2 performance data, EED, and location certificates, can also be stored here.
- Through collaboration with a user group, we continually work on expanding the functionalities.
- Controlling maintenance costs is an important focus for operators. The ability to control systems remotely can reduce maintenance costs. Additionally, the costs of an actual malfunction can be significantly reduced in many situations.
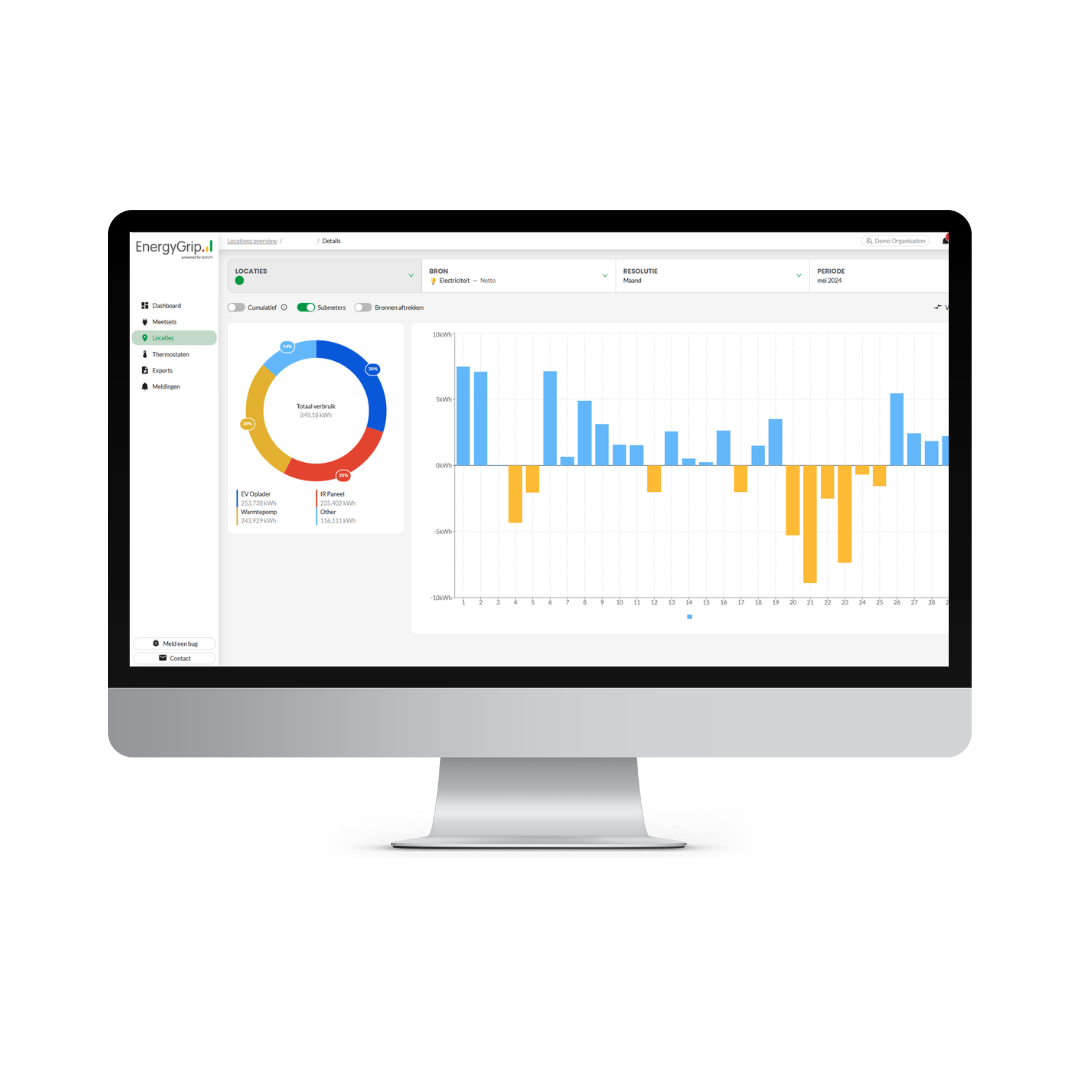
View data by location
- All data are consolidated by location.
- Users can be authorized per location, allowing each user or manager to work with the data of that location.
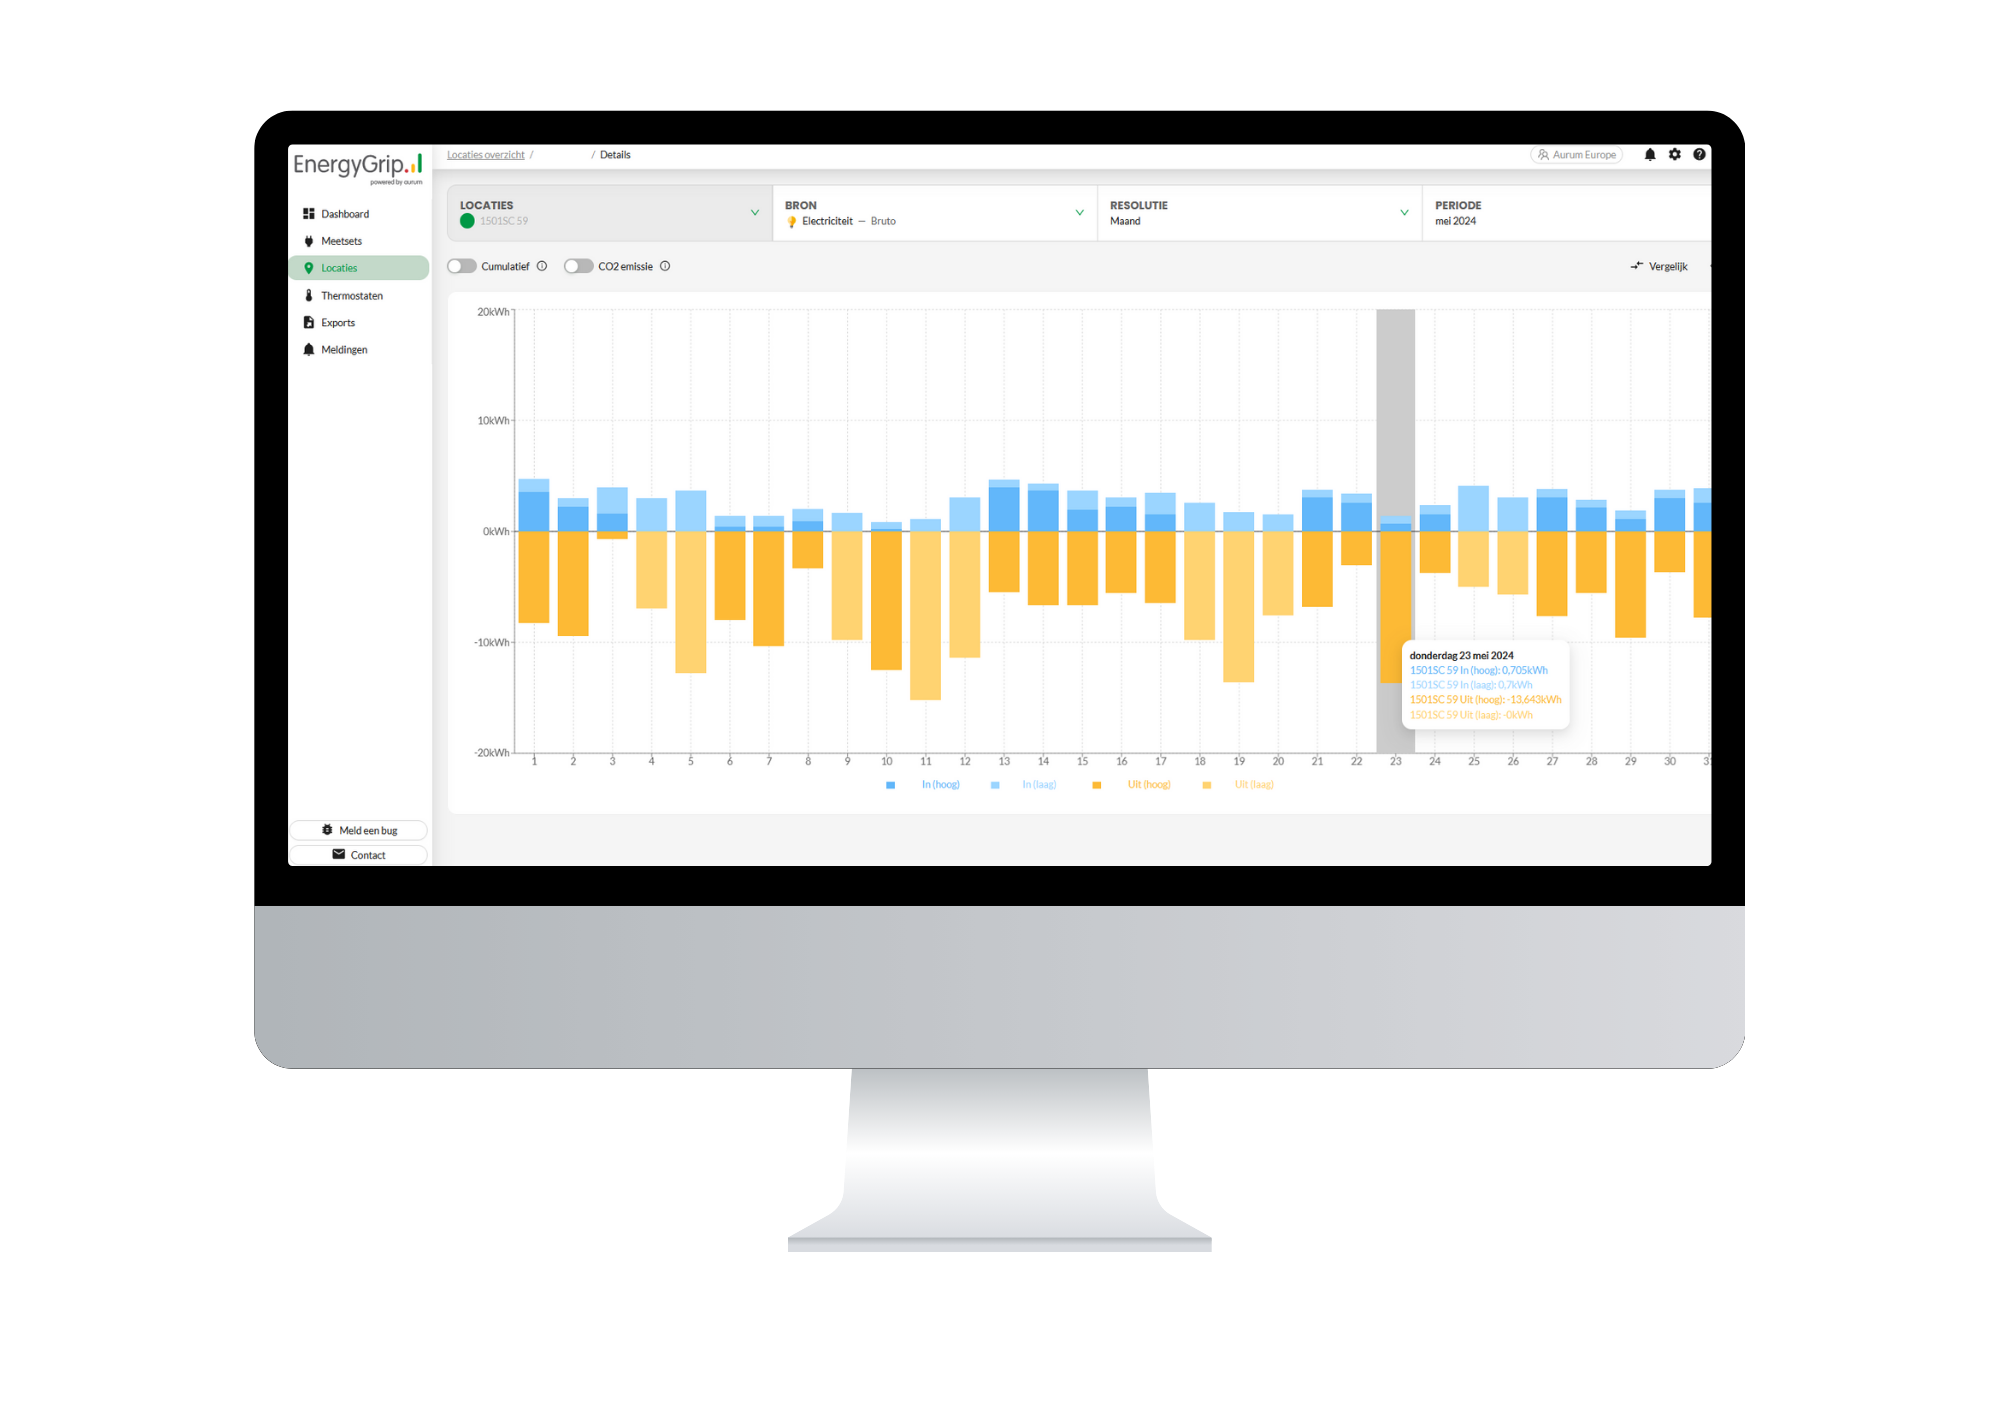
- Switch between graphs for gas, electricity, and heat.
- In the electricity view, the data are visually displayed in one clear graph.
- You see both the measurement data and the invoice data.
- By combining invoice and measurement data, we can easily monitor the contracted power versus the registered maximum power.
- We can assist in obtaining an increase in contracted power or advise on reducing the maximum peak load.
- The basis for energy savings and further sustainability of real estate is establishing the starting position through a baseline measurement.
- What is the current consumption? Where is energy currently being wasted? What installations are used at the various locations?
- Our energy management system captures this first step in the process.
- Subsequently, the system helps in adjusting the sustainability trajectory and demonstrating adjustments based on data
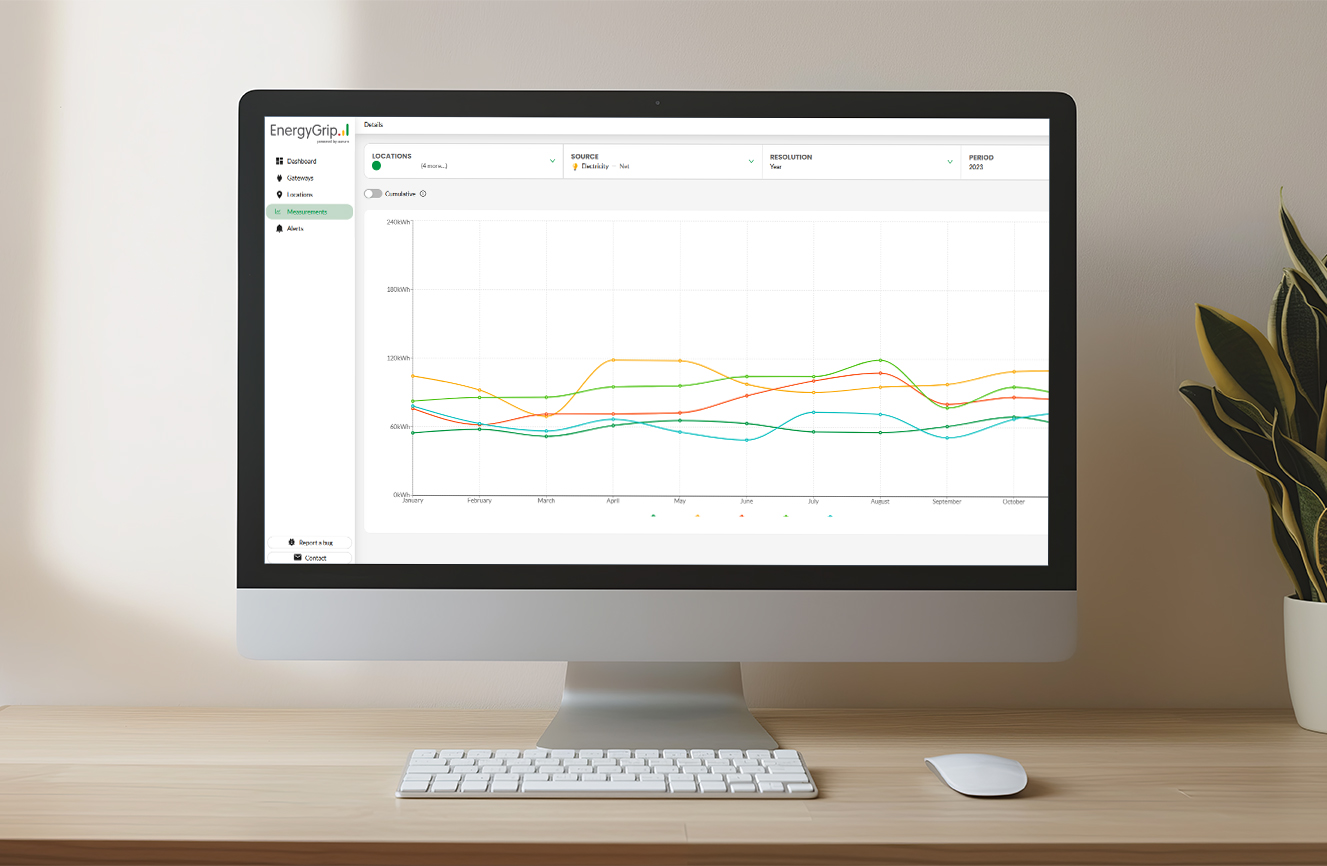
Insight at month-, day-, and quarter-hour level
With just one click, you can view data on consumption on a monthly, weekly, and daily basis. The 24-hour graph is based on quarter-hour and hour values. You also have the option to zoom out: view an annual overview or data from multiple years in one view. Detailed insights give organizations more opportunities to steer effectively. Improved insights also contribute to achieving goals, such as reducing the CO2 footprint.
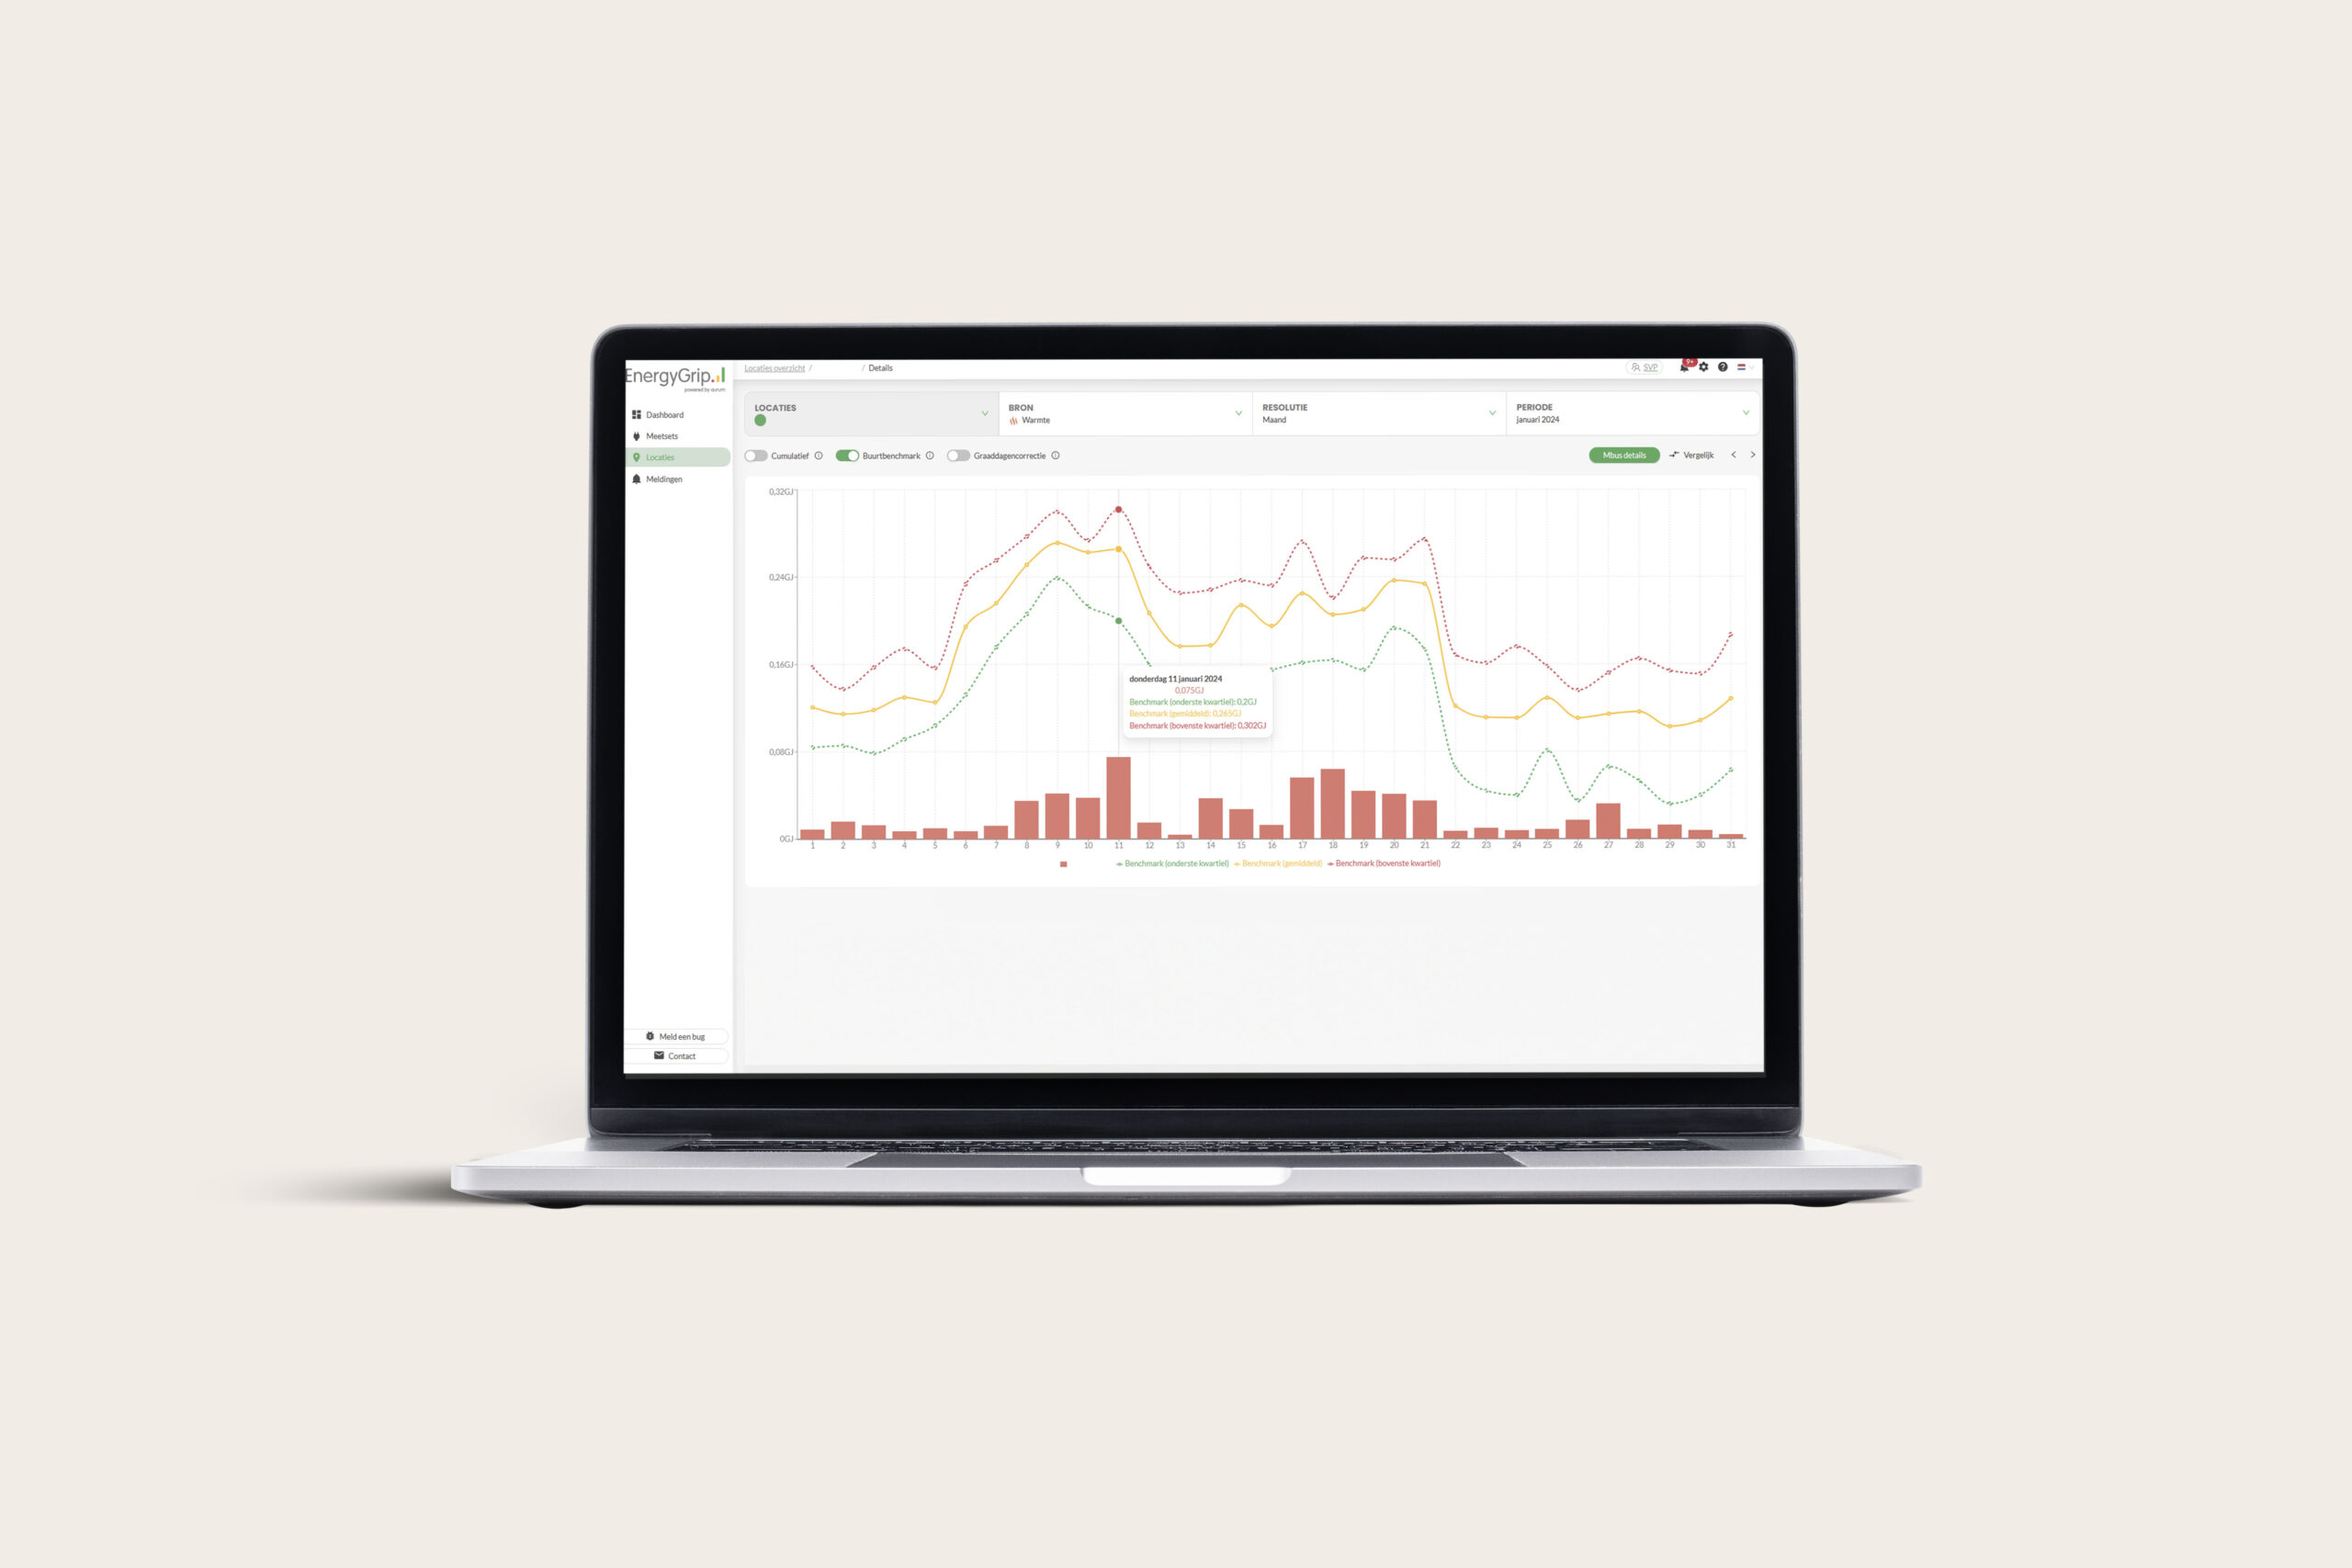
Comparison
By comparing locations, you can quickly and easily determine if there are buildings that need special attention. Our benchmarking process takes into account the gross floor area of the locations. You can also compare the consumption of a location over different periods. With EnergyGrip, you can perform detailed analyses of energy consumption for electricity, gas, heat, and water. Additionally, we have included weighted degree days in the analysis, allowing you to draw the right conclusions based on the comparisons.
Benefit: optimization of maintenance costs
Controlling maintenance costs is an important focus for operators. The ability to control systems remotely can reduce maintenance costs. Additionally, the costs of an actual malfunction can be significantly reduced in many situations.
Energy generation
- When a location has solar panels, the tool shows how much energy is generated and fed back into the grid.
- For this, the building must be equipped with a gross production meter or software that allows our tool to be connected via an API.
- We can arrange the application for this meter or look for the right connection to receive the data.
- Our display of energy generation focuses on the net consumption of the location, and we provide advice on the optimal use of self-generated energy.
Insights for end users
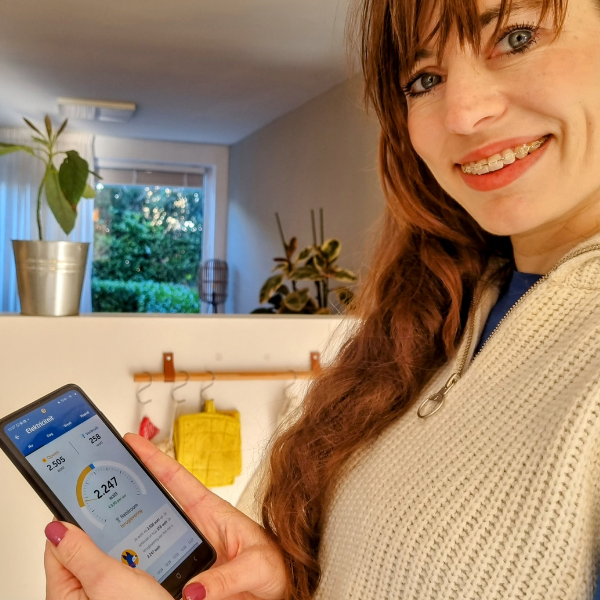
For end users such as apartment residents and subtenants, it is often difficult to gain insights into their energy consumption. With the energy app on their mobile phone, they can monitor their consumption in real-time, helping them to be more conscious of their energy use and save costs. This solution offers:
- Real-time data
- User-friendly environment
- Insights into consumption, savings opportunities, and cost reduction

Case study: Change=
Change= is building a living concept where working, living, learning, and life are combined affordably. With the use of EnergyGrip, we provide real-time insights into the energy consumption and generation of 600 apartments. The building is gas-free: solar panels are installed on the roofs, and the studios are connected to district heating.
Change= uses EnergyGrip to digitize district heating consumption, electricity consumption, and water consumption. The data are used to monitor the assets, for billing, and to give residents insights into their consumption to prevent waste.

Case study: Veiligheidsregio Zeeland
Thanks to the implementation of the Aurum solution, Veiligheidsregio Zeeland was able to save significantly on energy costs: 7% on gas, 5% on electricity through insights, and overall 30% through control. The insight into consumption data and the ability to manage heating remotely led to more efficient energy use at various locations, minimizing unnecessary costs. The system offers not only cost savings of nearly €100,000 in the first year but also the flexibility to adapt energy management to the specific needs of each location.
Let’s meet!
Want to gain more insight into your energy consumption? Let’s conduct a no-obligation assessment together to discover how we can make your energy data visible, save costs, and become more sustainable!
CALL US
+31(0)85-2019274
Or let us contact you